
News
Strata autonomous loop: RTX 3060 vs Mac Studio M3, first results
One model (Qwen3.8-Flash-Next IQ3_S), the same files and the same Strata version on two very different configurations. Data from the last 12 hours.
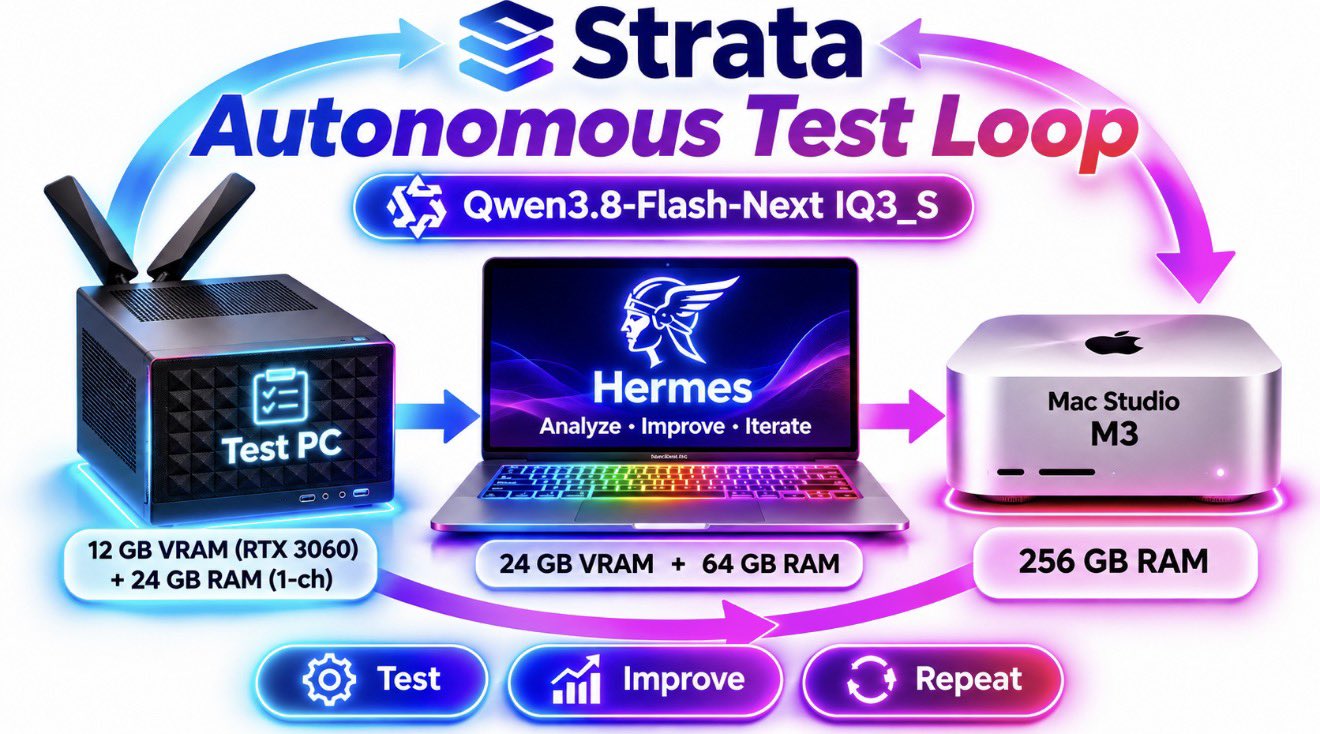
Configuration
- Experiment PC: RTX 3060 with 12 GB VRAM and 24 GB of single-channel RAM; extremely tight memory and aggressive runtime settings. Runs 24/7.
- Hermes (computer P2005): 24 GB VRAM and 64 GB RAM. Analyses results, verifies the work, makes improvements.
- Mac Studio M3: 256 GB of unified memory; the whole model fits in memory. Parallel comparison runs.
- Identical model files, model version and Strata version on all systems; identical tasks and matching repetitions.
What is measured
- Usefulness on real-world tasks with limited hardware.
- Degradation with large context windows.
- Answer quality across different hardware.
- Whether the model can improve its own work: find errors, fix them and prevent them in a continuous loop.
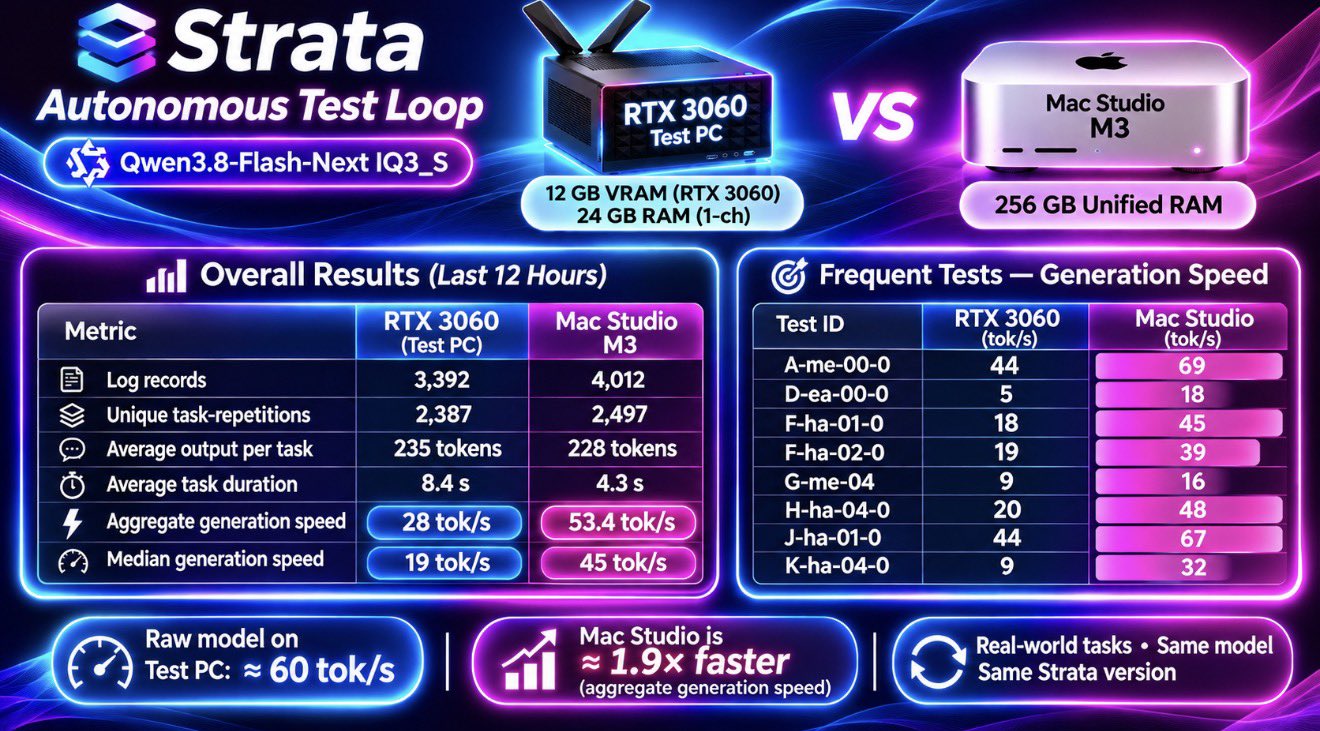
Speed, last 12 hours
| Metric | RTX 3060 | Mac Studio M3 |
|---|---|---|
| Log records | 3392 | 4012 |
| Unique task repetitions | 2387 | 2497 |
| Average output per task, tokens | 235 | 228 |
| Average task duration, s | 8.4 | 4.3 |
| Aggregate generation speed, tok/s | 28 | 53.4 |
| Median generation speed, tok/s | 19 | 45 |
| Task ID | RTX 3060, tok/s | Mac Studio M3, tok/s |
|---|---|---|
| A-me-00-0 | 44 | 69 |
| D-ea-00-0 | 5 | 18 |
| F-ha-01-0 | 18 | 45 |
| F-ha-02-0 | 19 | 39 |
| G-me-04 | 9 | 16 |
| H-ha-04-0 | 20 | 48 |
| J-ha-01-0 | 44 | 67 |
| K-ha-04-0 | 9 | 32 |
Aggregate generation speed is about 1.9× higher on the Mac Studio. The raw model on the experiment PC reaches about 60 tok/s. Hermes generates faster but has a different workload, so a direct comparison would be misleading.
Answer quality: v1.8 and v1.9
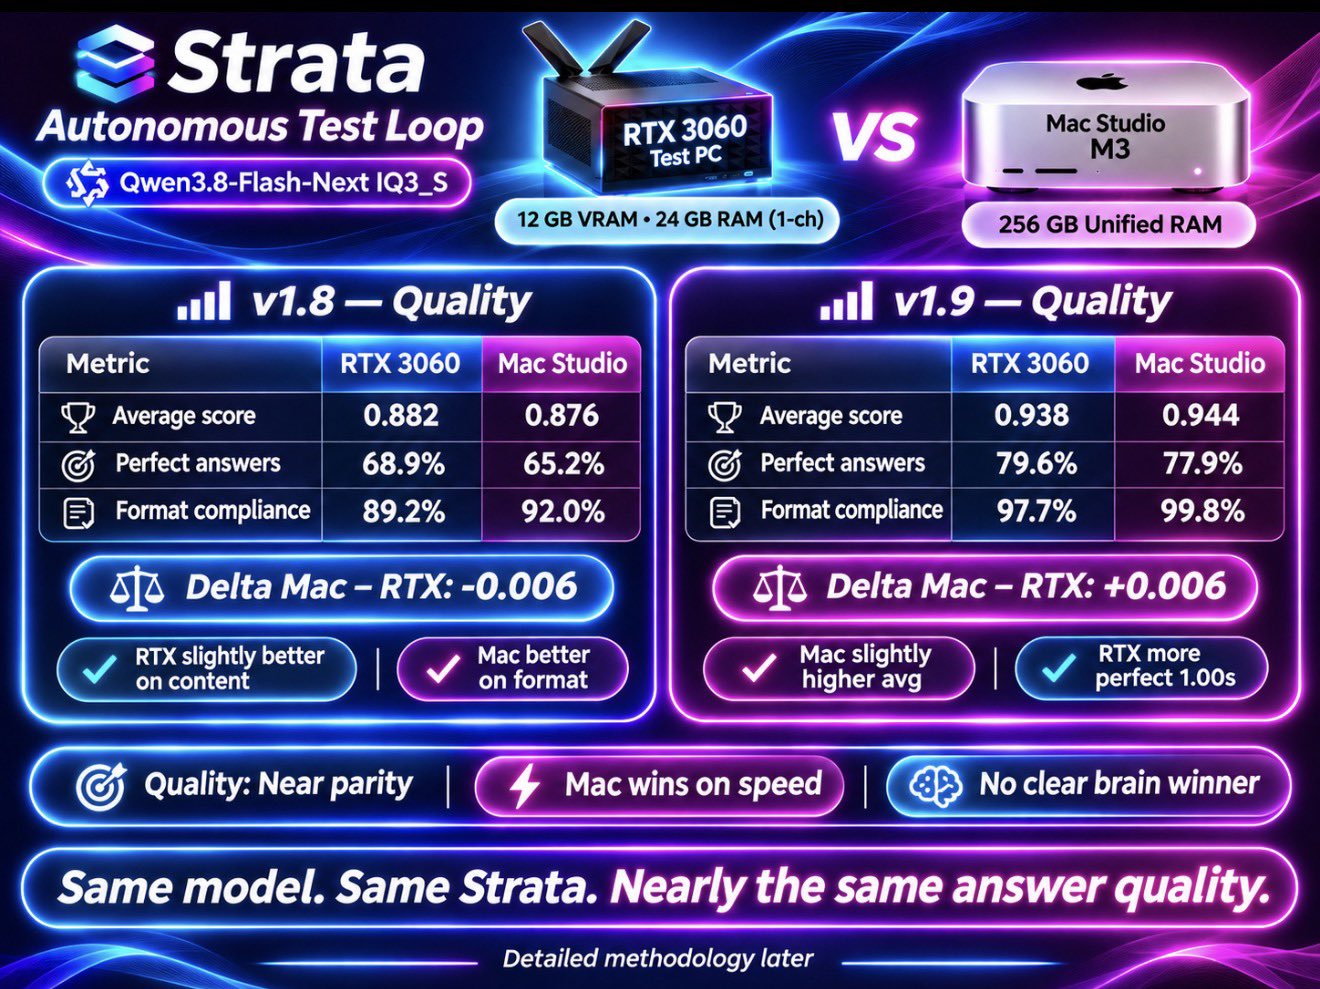
| Metric | RTX 3060 v1.8 | Mac Studio v1.8 | RTX 3060 v1.9 | Mac Studio v1.9 |
|---|---|---|---|---|
| Average score | 0.882 | 0.876 | 0.938 | 0.944 |
| Perfect answers, % | 68.9 | 65.2 | 79.6 | 77.9 |
| Format compliance, % | 89.2 | 92.0 | 97.7 | 99.8 |
| Difference Mac − RTX | −0.006 | +0.006 | ||
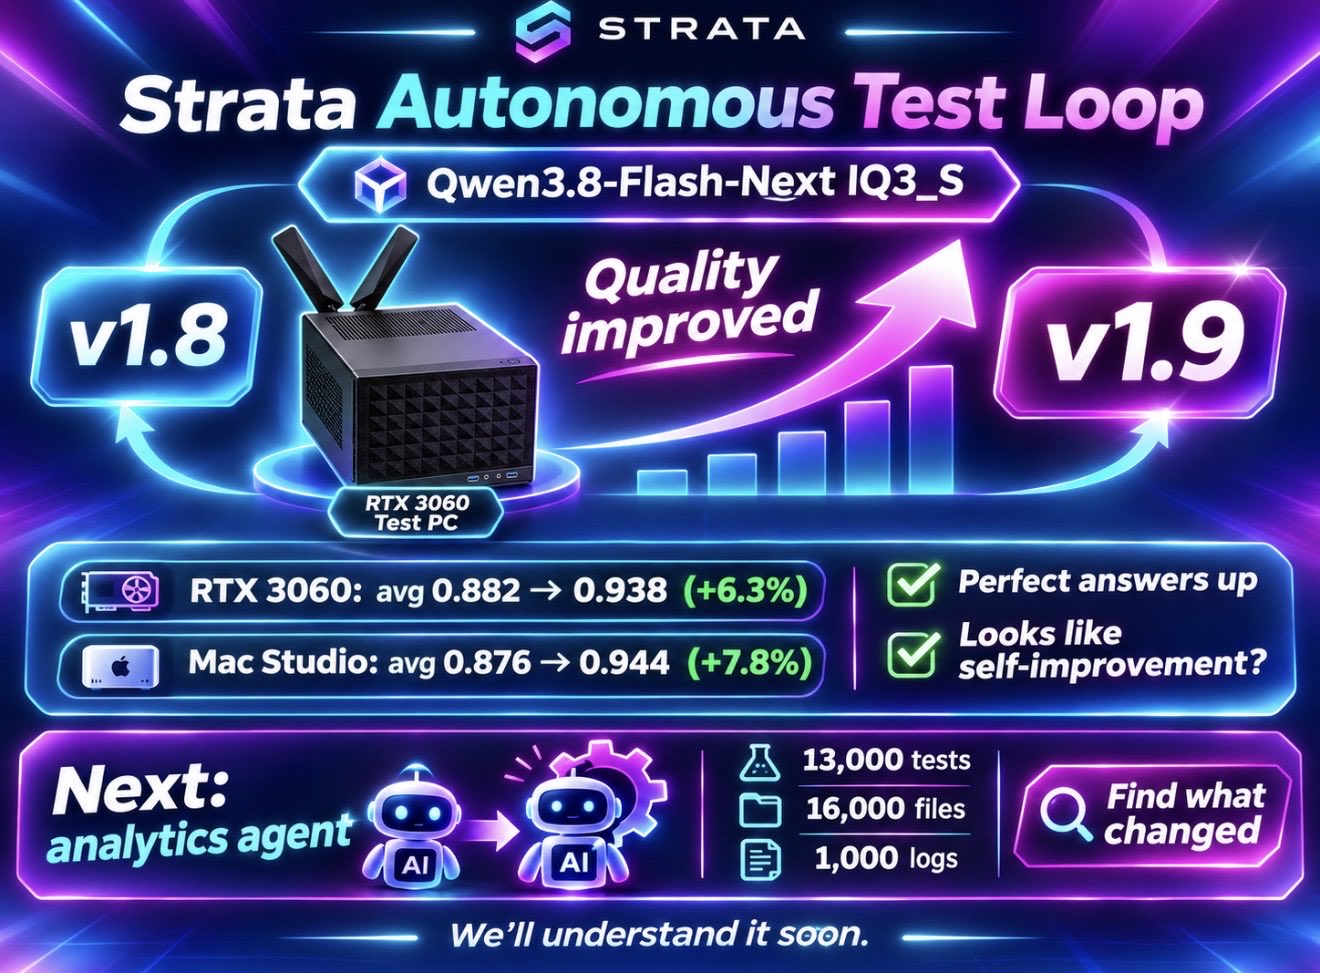
Quality is near parity; the Mac wins on speed. From v1.8 to v1.9 the average score rose by 6.3% on the RTX 3060 and by 7.8% on the Mac Studio; the share of perfect answers also rose. Differences by category are still being analysed.
Agent behaviour
Without being asked in the prompts, the agent began to estimate the token cost of its improvements and, in some versions, to optimise its processes to cut unnecessary token use.
Next
Data collected: 13,000 runs, 16,000 files, 1,000 log files. A demo of an analytical system is being built for deeper analysis of the results of this experiment.